This blog was formatted from comments on last week's Energy Management blog (>35, pitch/power discussion). Rich Stowell checked in and his comments, reprinted here, are especially valuable for all pilots and educators. His FREE "Learn to Turn" course offers even more extensive guidance.
 While a good start, the new “Energy Management” chapter in the 2021 FAA Airplane Flying Handbook devolves into the usual trap of a designer-oriented approach to training. As pointed out by Langewiesche in Stick and Rudder, “What is wrong with ‘Theory of Flight,’ from the pilot’s point of view, is not that it is theory. What’s wrong is that it is the theory of the wrong thing—it usually becomes a theory of building the airplane rather than of flying it.”
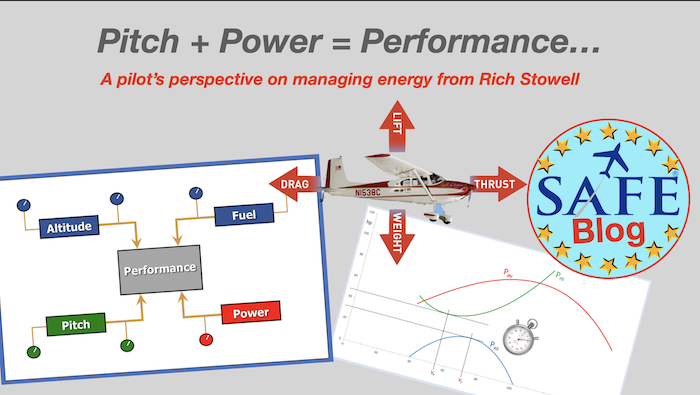
The first principle of flying light airplanes is “Pitch + Power = Performance.” This succinct statement points to energy management. But it is so much more than that. Substitute angle of attack (AOA) for Pitch; thus, “AOA + Power = Performance.” Airspeed (V) and G-load (G) are proxies for AOA. Hence, “V + G + P = Performance.”
 This simple statement takes us to the two types of airplane performance we care about: Climb Performance and Maneuvering Performance. The V-P diagram illustrates climb performance. In this context, “climb” can be positive (climbing), zero (level), or negative (descending). We can talk about energy; which axis is controlled with throttle; which axis, with elevator; what happens on the back side, the front side, and way on the front side. We can include excess power (Pxs = Pav – Pre), which translates into rate of climb (ROC).

 We can overlay and discuss critical V-speeds such as Vm, Vs, Vh, and Vne (vertical lines drawn on the diagram); Ve and Vy (horizontal lines); and Vx and Vbg/Vbr (tangent lines). We can discuss the effects on the performance of things such as airplane configuration, density altitude, and bank angle.
We can map out a go-around. Say, for example, we add go-around power while at 60 knots. Achieving max ROC is important in this example, which is a touch over 70 knots. Pushing the elevator control forward allows us to climb at a faster rate. This is counterintuitive (just like stall recovery) unless we understand the V-P relationship. Similarly, there are speeds on either side of Vy that, with go-around power applied, result in the same ROC albeit slower than max ROC. In one instance, we would have to push to speed up and thereby climb at a faster rate; in the other, pull to slow down and thereby also climb at a faster rate. Again counterintuitive, but normal in terms of the V-P relationship. We can correlate key speeds like Vy with their corresponding pitch attitudes, too, should we ever lose our airspeed indicator.
We can even map out and discuss a complete engine failure (P = 0), in which case the V-P diagram flips and becomes a Rate of Descent vs. Speed diagram (ROD-V). Correlate the glide attitude with your best glide speed here, too.
The V-G diagram, on the other hand, illustrates maneuvering performance within the confines of the airplane’s aerodynamic and structural limits. The same Vne line from V-P transfers to V-G. The same Vs line transfers as well, but the V-G diagram shows us all the stall speeds from zero G to the design limit G.
Whatever we say about the V-P diagram must be consistent with, and transferrable to, the V-G diagram and vice versa. Does anyone think we can substitute power settings along the V-axis on the V-G diagram, making it a P-G diagram?
When they happen to be discussed, V-P and V-G are presented as totally unrelated pictures. The reality is that three parameters tell us what the airplane is doing at any point in flight: V, G, & P.
 Since V-P and V-G diagrams share the same speed axis, imagine connecting the two diagrams at right angles to each other along the V-axis. Imagine an airplane in flight in the space between the two diagrams. Projecting the airplane’s shadow onto the V-P diagram informs us about its climb performance at that moment. Likewise, projecting the airplane’s shadow onto the V-G diagram tells us how it is maneuvering at that moment. Alternatively, we might think of the V-G diagram as a toaster with an infinite number of thin slots to accept an infinite number of thin slices of V-P bread. The graphic shows this concept for level flight at 1G. This slice of the envelope is bounded by the 1G stall speed, Vne, and the available power.
The interplay between pitch and power on performance should be clear, as should the primary use of elevator and throttle controls. Also note that pitch is assigned as AOA/speed control and power as altitude control during the most critical of flight operations:
- The mountain, canyon, and backcountry flight environments (Mountain, Canyon, and Backcountry Flying, Amy L. Hoover & R.K. Williams; Mountain and Canyon Flying Training Manual, Lori MacNichol)
- The technical logic of airplane performance (Performance of Light Aircraft, John T. Lowry)
- AOPA articles (Fatal Instinct and Power and Pitch, Barry Schiff)
- The flippers and the throttle (Stick and Rudder, Wolfgang Langewiesche)
- Fundamentals of flying technique (FAA)
- Fundamentals of stall recovery (FAA)
- Go-around/Rejected Landing (FAA)
Likewise, airplane manufacturers assign pitch for AOA/speed control and power for altitude control during critical flight operations and emergencies in their airplanes. For example, see the amplified procedures in the Cessna 172P:
- Short field landing
- Landing without elevator control
- Glassy water landing (floatplane version)
- Engine failure
- Emergency descent through clouds
- Recovery from a spiral dive (in clouds)
Teaching Pitch and Power
Pitch. The elevator control moves fore and aft. The airplane’s response is seen as head-to-feet movement by the pilot. The primary effect is on angle of attack, which presents as changes in at least a couple of these: V, G, attitude, flight path. Possible secondary effects might include changes in rigging and engine effects, gyroscopic precession, angle of bank, and altitude.
Power. The throttle moves fore and aft. The primary effect is to move the airplane here-to-there (taxi from one location to another on the airport; fly from airport A to airport B; climb or descend from one altitude to another). Possible secondary effects might include changes in torque, p-factor, slipstream, and airspeed.
Do we inadvertently, negatively reinforce “use the secondary effect of pitch for altitude” as the norm, which by default makes all the above scenarios the exceptions? Or is “using the secondary effect of pitch for altitude” really the exception, especially since we must be in just the right slice of the envelope, close to the correct altitude profile already, and with speed that we either don’t need or don’t really care about to achieve the desired effect?
Does our approach to teaching the V-P relationship along with the trainee’s practical experience spent mostly in one part of the envelope contribute to the potentially dangerous pull response in other parts of the envelope? How do we push learning to the correlation level for the entire performance envelope?
Stripping away the apparent complexity in the FAA’s energy management chapter—especially with regard to the most critical energy state scenarios—returns us to the primary roles of pitch and power as illustrated on V-P and V-G diagrams. Hence my motto: “Pitch for the speed you need.”
 The “SAFE Strategies” was just published with SAFE Board Candidates (please vote) and details on #OSH22. Our SAFE dinner is on campus at the EAA Partner Resource Center
 Our show booth is in Hangar B booth #2092 for renewal benefits and a chance to win sweepstakes prizes (Zulu 3 from Lightspeed, Aerox O2 system), SPorty’s
Tell us what *you* think!